Reporting Portal Overview
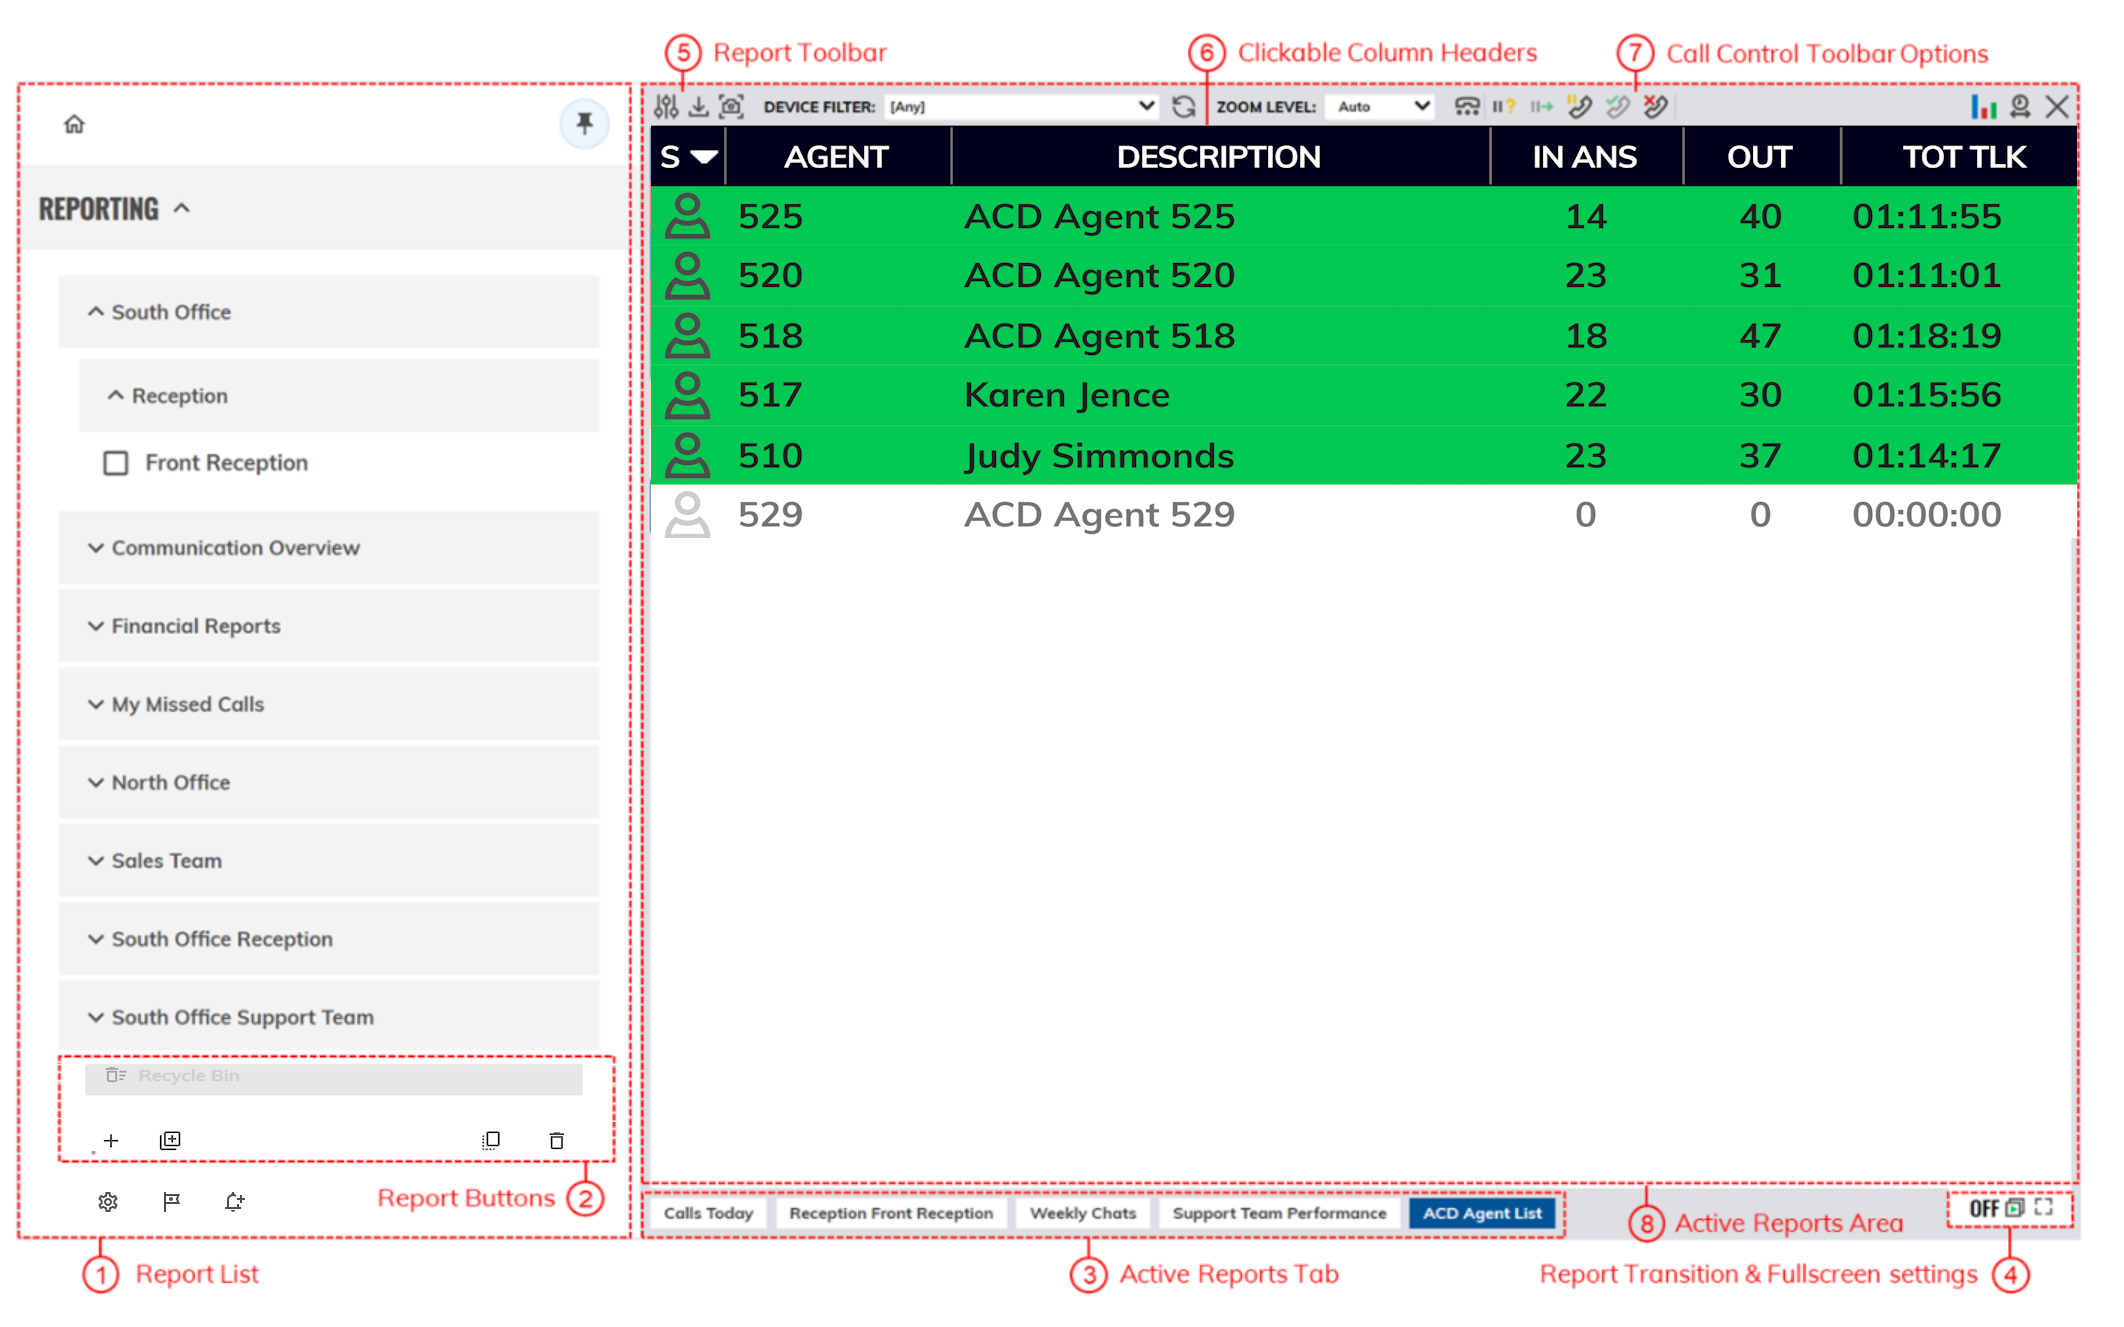
To access your reports, click on the ‘Reporting’ tab found within the main menu after signing into the Akixi Service with your user credentials. The main areas of the Reporting Portal are shown below:
Reporting Menu (Legend 1)
The ‘Reporting’ section contains a set of pre-defined reports which you are able to configure according to your requirements. You can open or close this area by using the pin button at the top-right of the list’s title area to pin or unpin the menu.
Report Buttons (Legend 2)
 | Click this button to add a new report. This immediately displays the ‘Add/Modify’ report window where you can choose the style of the report and configure filtering and other report settings, before clicking the ‘OK’ button to actually save and open the newly created report within the ‘Active R eport Tabs’ area. |
 | Click this button to modify the currently selected report. |
 | Click this button to delete all the reports that have been selected. |
 | Click this button to make a duplicate copy of all the selected reports. |
Active Report Tabs (Legend 3)
The ‘Active Report Tabs’ list shows a tab for every currently open (run) report. The tabs allow you to select which report is currently being shown within the ‘Active Report’ area by left-clicking the corresponding tab. The currently displayed report is shown highlighted, whereas all the other tabs are coloured grey. You can also drag and drop a ‘Report Tab’ to change its overall display order within the ‘Active Report Tabs’ area.
Report Transitioning & Fullscreen Settings (Legend 4)
The ‘Reporting’ portal supports the automatic display switching of active reports. This feature automatically cycles through all open reports in the same sequence that they are listed within the ‘Active Report Tabs’ area and displays each report for a defined interval. Left-clicking the transitioning status area icon (bottom-right of the ‘Reporting’ portal) toggles whether the report display transitioning feature is turned on or off.
Clicking the square expand icon will display the report in full screen mode with just the report and the open report tabs in view.
The Report Toolbar (Legend 5)

The ‘Report Toolbar’ is shown for the current open report and allows you to customise how the report is displayed. Please be aware that the display may differ when you run reports on tablets and mobile devices.
 | The ‘Change Report’ button displays the ‘Report Properties’ window and allows you to modify the report. Examples of these modifications include applying filters, scheduling, setting alarms, and also excluding call information that is not required to be viewed within a report. |
 | This button allows you to immediately create and view a PDF, RTF or HTML view of the report which can be printed. Typically, this is used for ad hoc usage although the report scheduling feature can also be used to deliver reports as a PDF via e-mail. |
 | This button allows you to create a snapshot of the reporting screen which can be useful in real-time reports. |
Device Filter | The ‘Device Filter’ allow you to filter reports by particular hunt group or devices. The drop-down box allows you to select the relevant devices and/or extension users, or alternatively you can add content to the free text box by using commas. It is also possible to group sequential numbers using the dash symbol, e.g. ‘012345600200, 012345600300-012345600305, 012345600328’. |
 | By clicking the ‘Refresh’ button the report can be immediately updated if any relevant changes have been applied using filters. |
Zoom Level | The ‘Zoom Level’ controls the size of the display for non-wallboard reports. This can be useful if you wish to increase the size of the data that is being displayed. Alternatively, various browsers may require the size of the report to fit neatly in the desktop viewing area. |
 | The ‘Tile Arrangement’ button allows you to customise Wallboard reports in order to switch it into chart viewing mode. Please be aware charting is only available within Akixi Supervisor Standard and Enhanced reporting. |
 | This feature allows non-wallboard reports to be viewed as either a detailed table, one of the two BLF views, or as a chart. Again, the charting feature is only available with the Akixi 1000, Akixi Supervisor Standard and Enhanced licenses. |
 | The ‘Date/Time’ filter allows you to customise the period the corresponding report is run across. This can be set to real time or other historic time frames. |
 | This button closes an active report. This will not stop the reports from being scheduled, but closed reports are not included within the transitioning (automatic report display switching) feature if enabled. |
Additionally if you hover the mouse icon over an ‘empty’ area of the ‘Report Toolbar’, a pop-up tool tip will appear that summarises the duration and filter setting(s) that are currently applied to the corresponding open report.
Wallboards
This report is best used in real-time and displays statistics in large individual tiles. Alarms can be incorporated in each tile providing thresholds/parameters. The wallboard provides a clear overview of the business’s performance based on the users being monitored. The individual tiles can be customised with a choice of colours and dials.
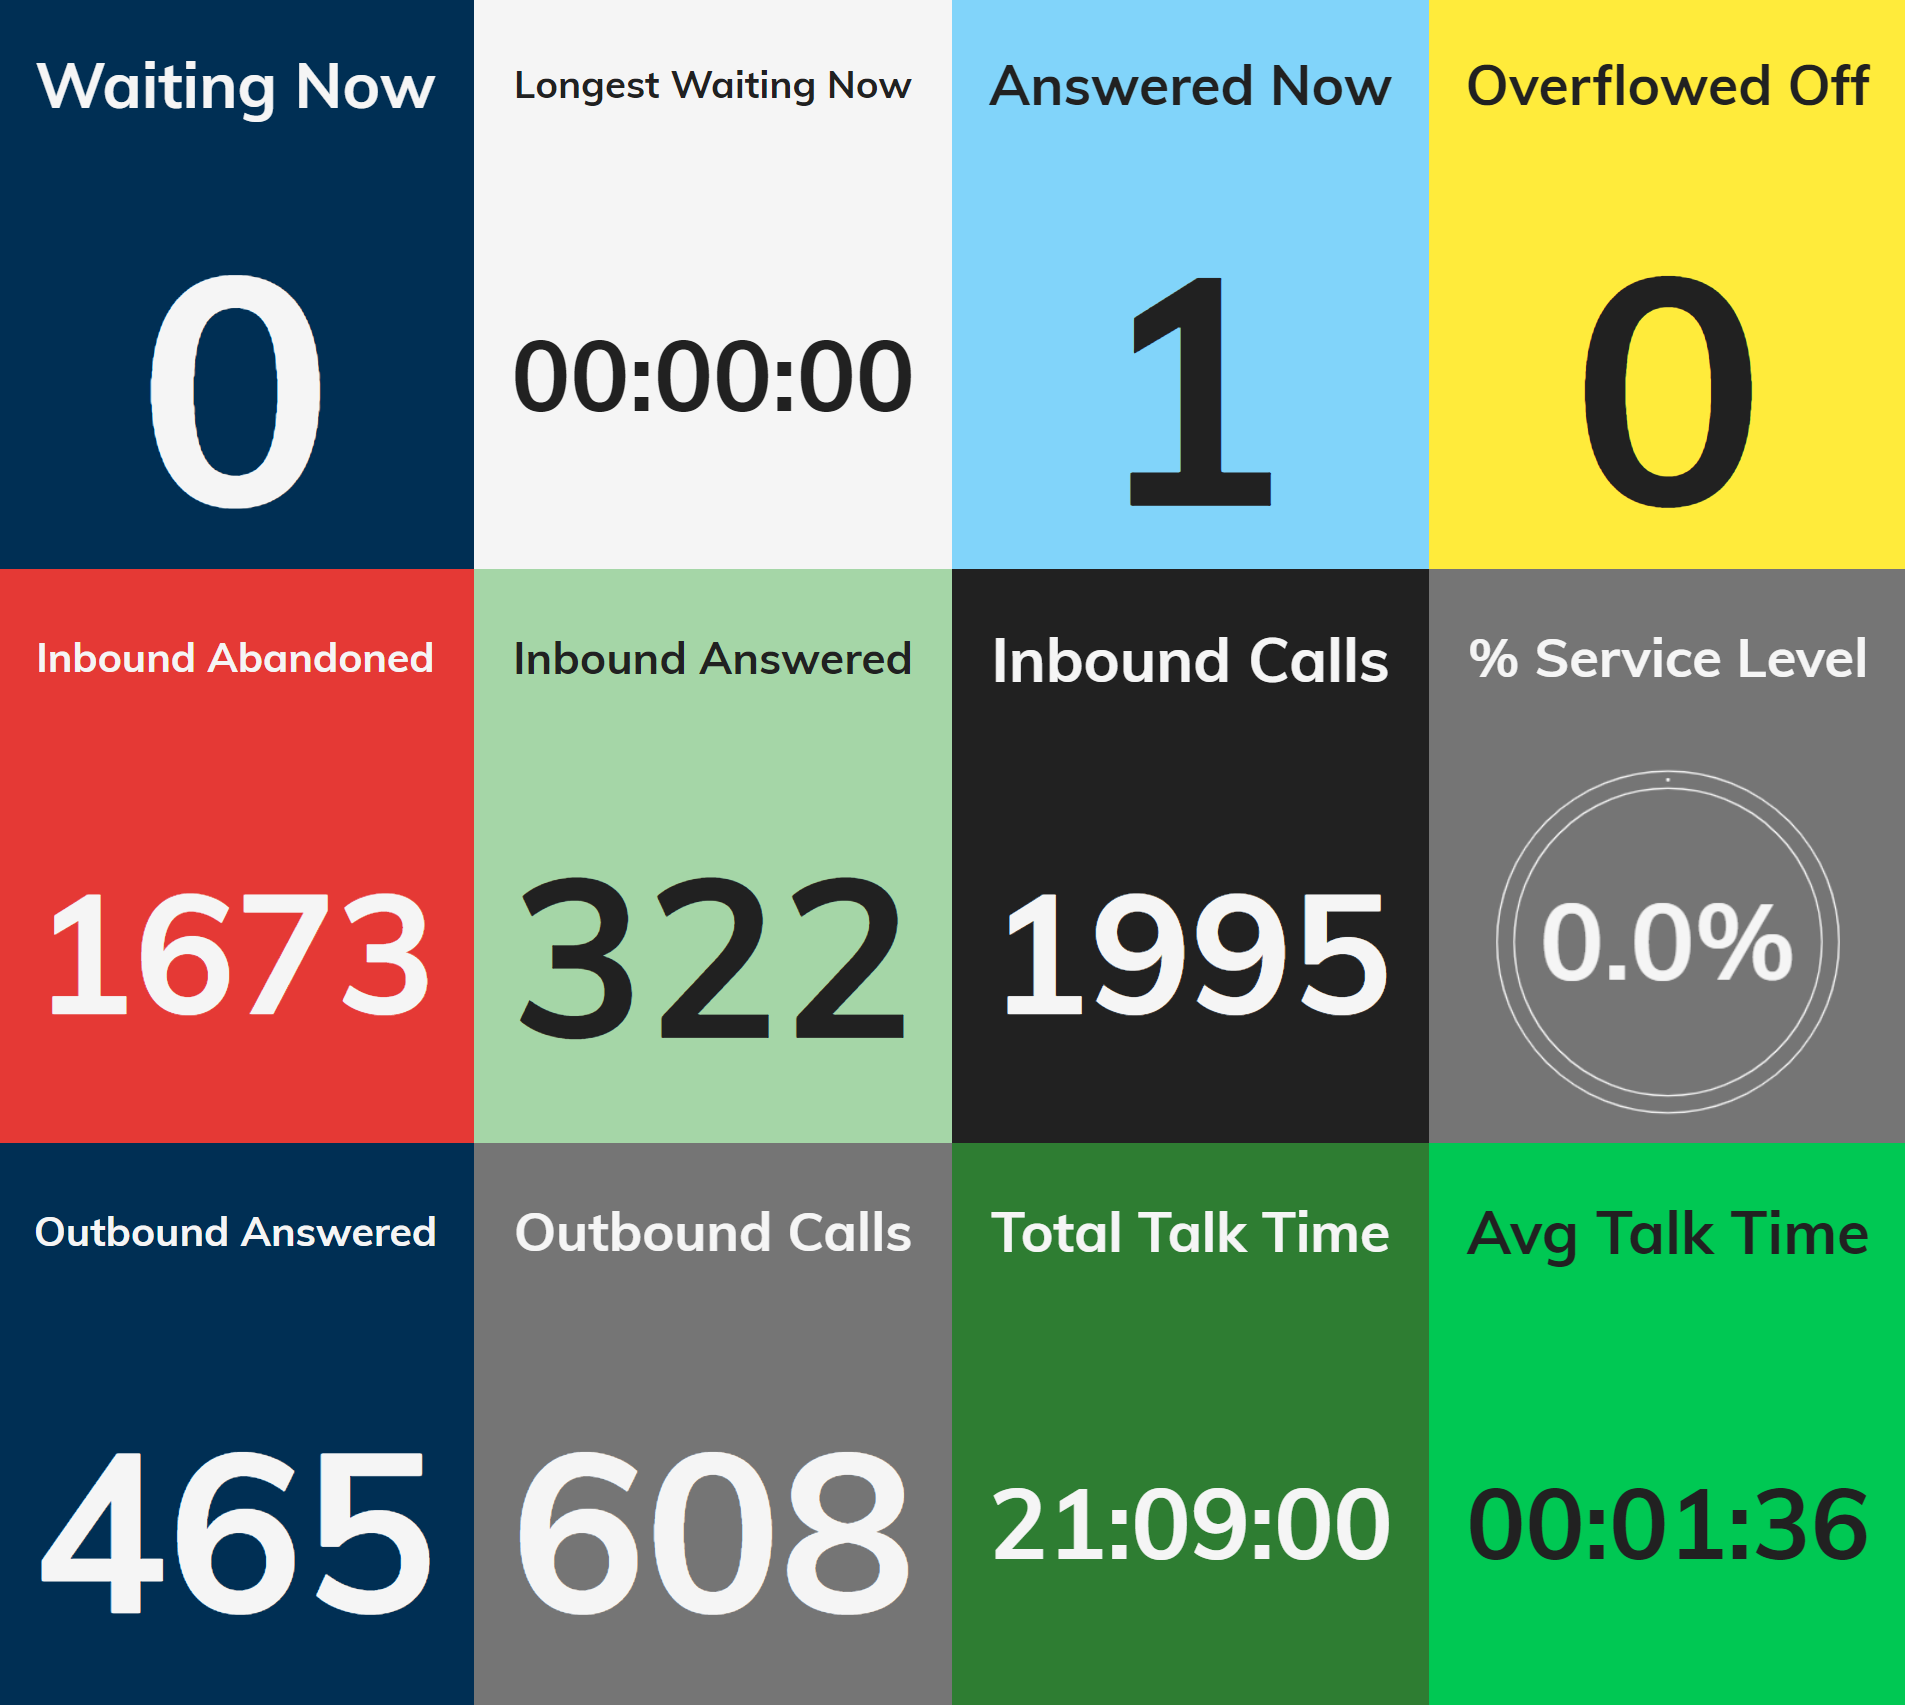
The wallboard is available with Akixi Supervisor Standard and Enhanced reporting. Certain statistics within the wallboard report are only available with Akixi Supervisor Ehanced reporting e.g. ACD agent statistics.
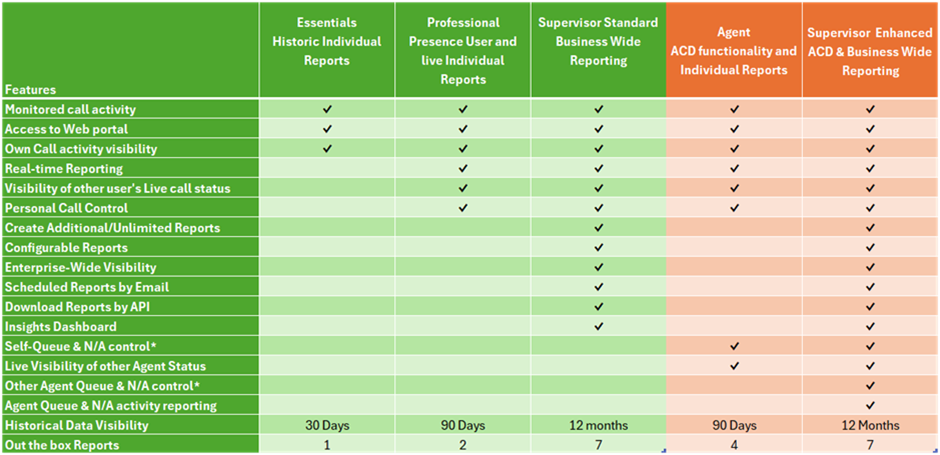
Extension Lists
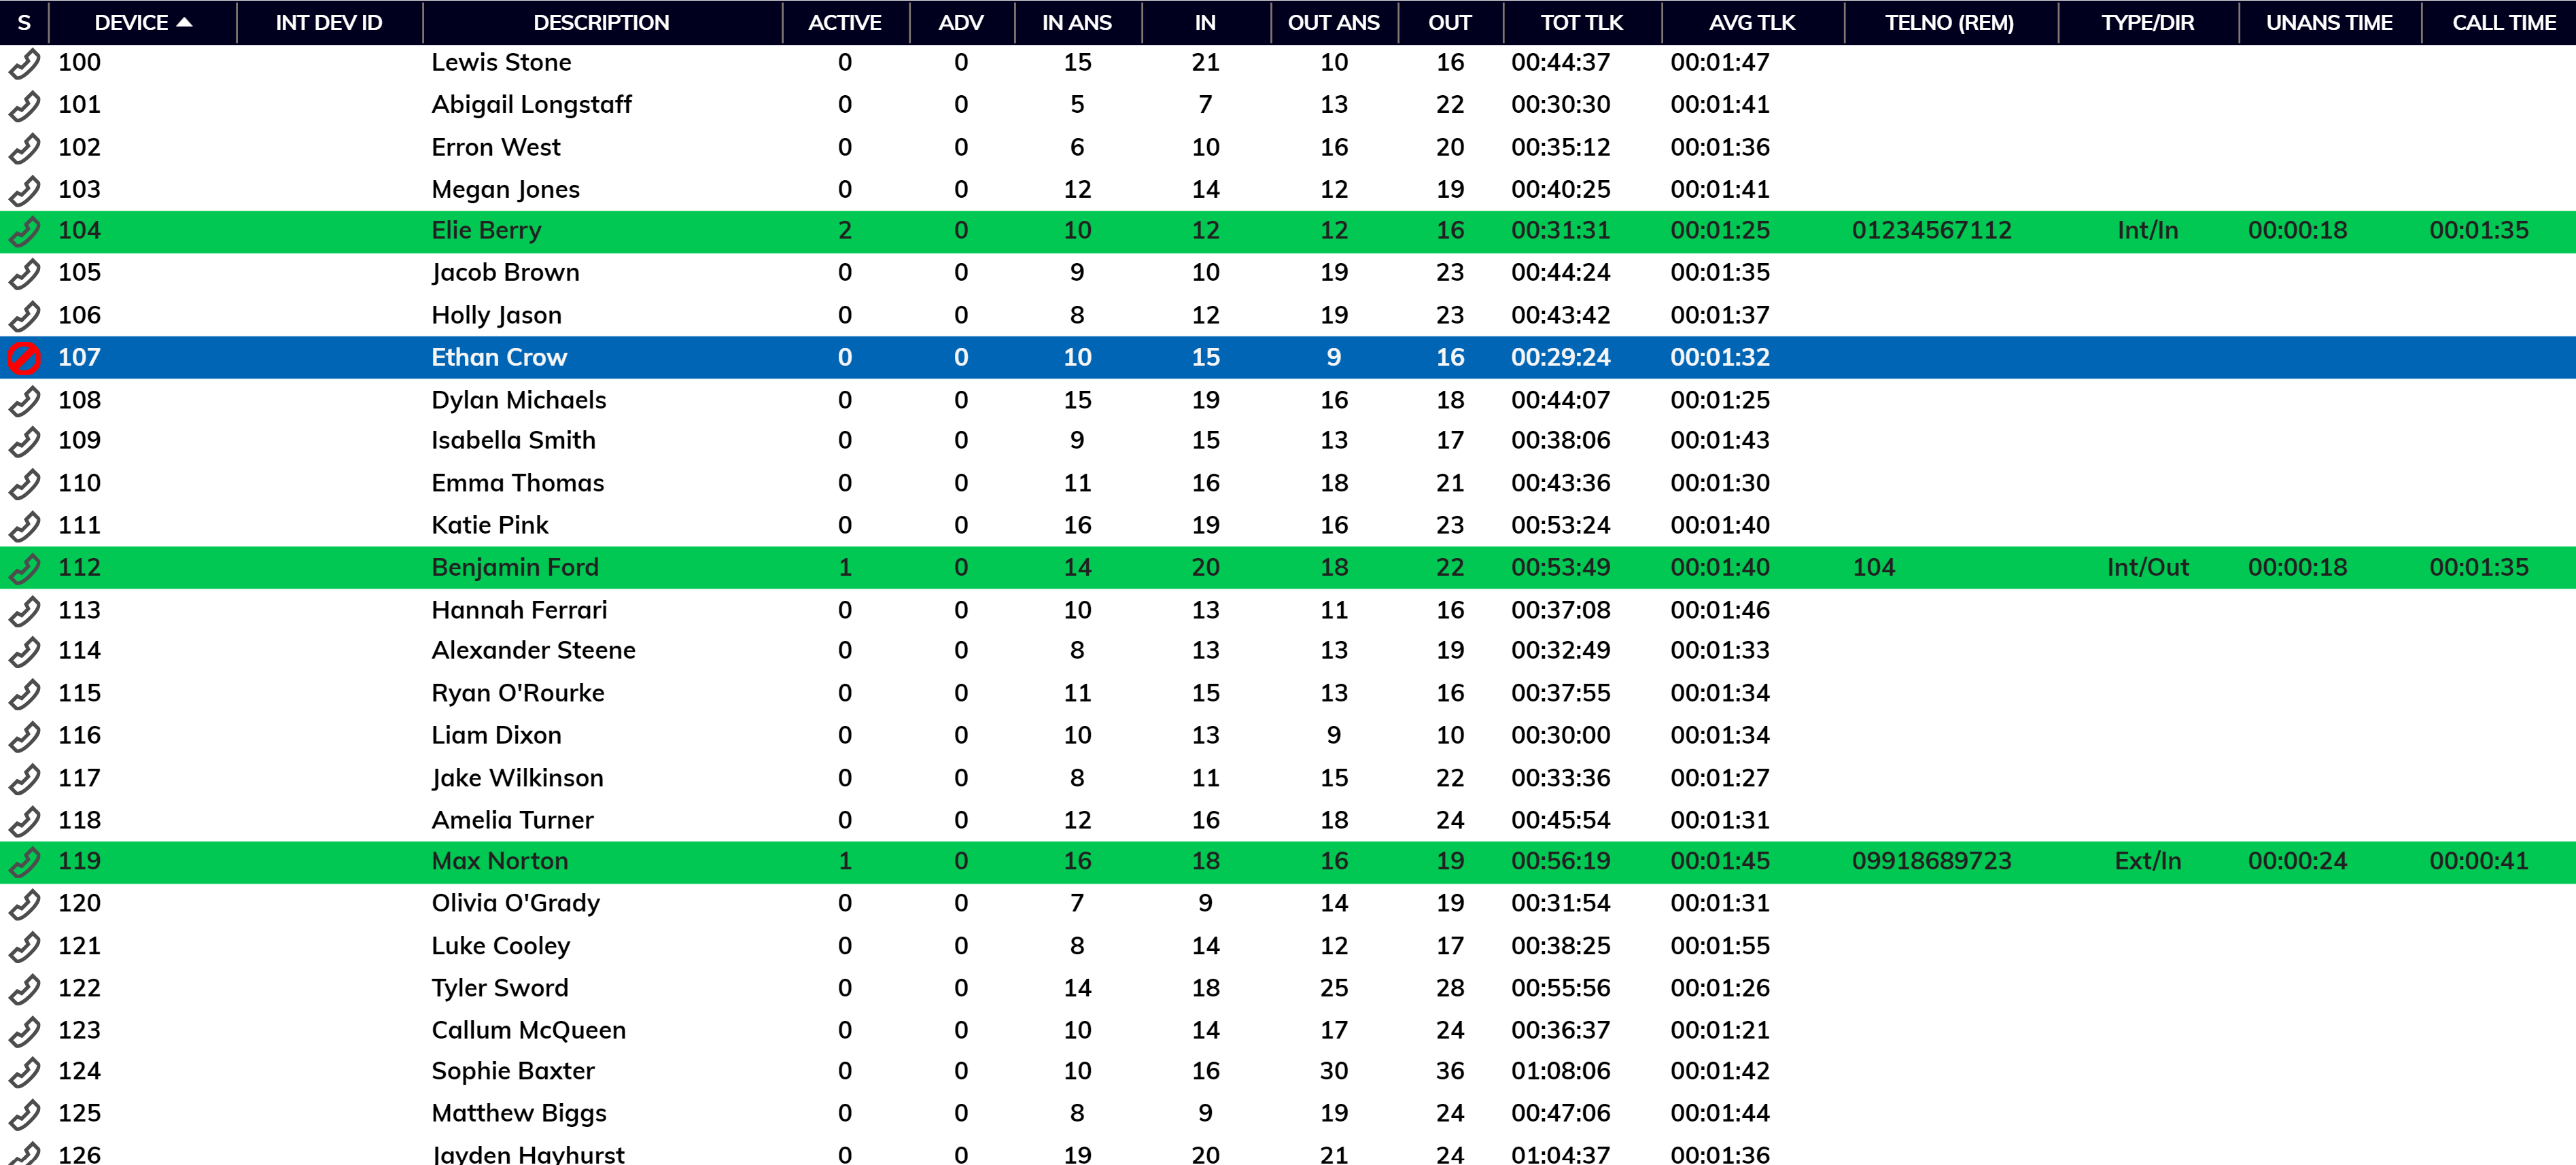
The ‘Extension List’ shows a list of all internal devices in a table excluding trunk and hunt group devices. Statistics are displayed against each item. This report style also supports dynamic row highlighting based on the corresponding device’s call state when running the ‘Real-Time’ date/time option.
Colour | Description |
None | The corresponding device is idle or it is off-hook where it is just starting to make a new outbound call. |
Pale yellow | The device is either being alerted by a call, or is making an outbound call that isn’t answered yet. |
Green | The device is currently busy responding to an active contact item. |
Blue | The device isn’t currently involved in any active calls/contacts and is currently set to reject inbound contacts. The device is either set to forward inbound calls to another location, or is set to a do-not-disturb (DND) state. Note that in BroadSoft BroadWorks telephony environments, the DND state of the underlying extension user account is specifically shown by the application, as opposed to the ‘local’ DND state at the corresponding phone endpoint. |
Dimmed text | The device is out-of-service probably because the device is unplugged or not properly connected to the telephone system. Alternatively, a previous request to monitor the device on the telephone system failed, which is usually due to an incorrect or expired monitor password being set against the device for systems that specifically require it. |
Unreturned Lost Call List
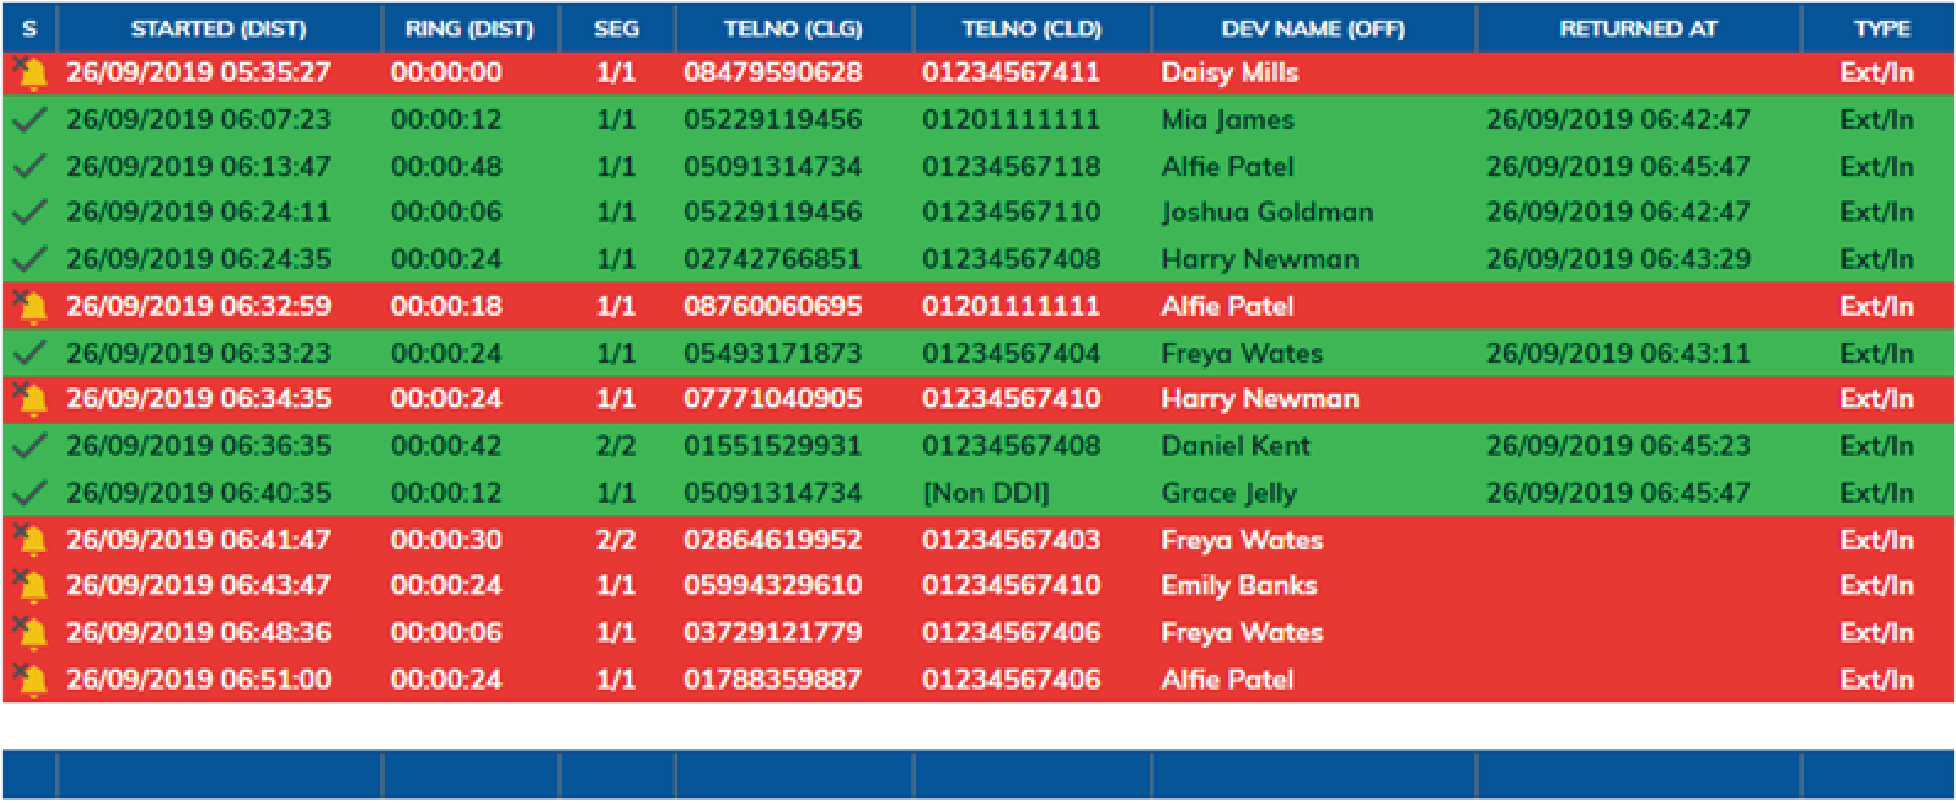
This is a useful report that displays a list of external inbound abandoned calls, where either the distant calling party has either not yet received a return call, or has not successfully called back in again and been answered by an internal extension user.
When run in real-time, this report shows new abandoned calls dynamically. Additionally, callers are automatically highlighted green when they have either been called back successfully with a return call, or the external party themselves calls back in again and is answered by an extension user.
Calls received by external parties withholding their CLI or CallerID are not shown within the report.
Historic Call List
This report type displays a historic list of records for contact segments that have already ended. The report may display multiple lines for the same call, which depict the segments of call. Generally, this will occur when the call is passed between various parts of the phone system e.g. an auto attendant onto a hunt group then through to voicemail. The stage of a call is always indicated with a segment number with the final leg being shown as 1/1, 2/2 or 3/3 etc.
Calls By ½ Hour Interval

This report style displays a list of half hour intervals that exist within the starting and ending duration that the corresponding report is run against. This report style is useful when viewing general call trends over the different times of the day across an entire reporting period.
Filtering
General
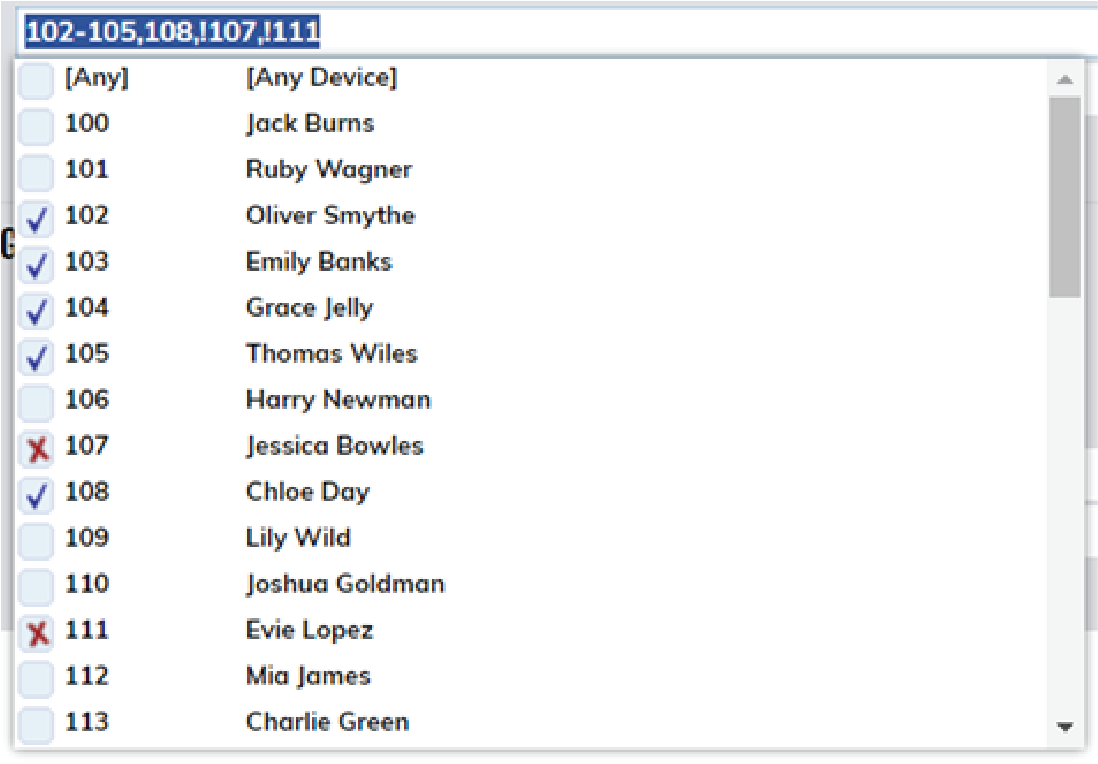
Filtering can be accessed by selecting ‘Locational Filtering’ within the ‘Filter’ tab of the ‘Report Properties’ window. Any report (excluding the ‘External URL’ report type) can be filtered by telephone number, extension device, hunt group device, and/or ACD agent filter.
If you wish to filter multiple agents / devices, this can be achieved by using a comma to separate them or by adding a range, for example ‘012345600200, 012345600300-012345600305, 012345600328’. To exclude any devices on your report add an exclamation mark before the extension e.g. ‘!012345600400, !012345600410-012345600419’.
Using either a left-click to include, or a right-click to exclude, you can also use the drop down device filter option across your toolbar.
To ensure browser optimisation, Akixi will always only display the first 150 monitored devices, although this can be increased on a report-by-report basis using the ‘Content Restriction’ settings within the ‘Advanced Tab’ of the ‘Report Properties’ window.
Quick Device Filtering
The ‘Device(s)’ filter option on the ‘Report Toolbar’ can be used to more easily filter the current report by devices, rather than having to access the ‘Report Properties’ window every time a device filter needs to be applied or changed.
Hunt Group Filtering
You can can filter on hunt groups in exactly the same way you can for devices. When looking at hunt group activity you can choose to monitor all the members within the group.
Note: When filtering by hunt group devices, the corresponding report can also be made to automatically include all calls made to/from the associated group member devices. This functionality is turned on by checking on the ‘Include Calls for Group Device Members’ setting within the ‘Advanced Tab’ of the ‘Report Properties’ window.
Scheduling Reports
Any report can be scheduled to run automatically at the time you specify. Reports continue to run even if you are not logged in. All reports can be configured to be automatically run and emailed to you, removing the need to be signed into the application.
Please note that if the ‘Automatically Calculate Duration…’ option is checked within the ‘Advanced’ settings area, then this will automatically calculate the duration required for the report e.g. current day, previous day, current week, previous week, etc.

For example, if the option is ticked and the report is being scheduled for a week day within working hours1, then the Akixi Service will assume that the report is required for the previous day’s statistics. Additionally, a daily report run within working hours on a Monday, will by default be run for the previous Friday.
Once this option is specifically unticked (i.e. not checked), the report is run for the date/time options currently configured against the report.
Please note that if you schedule your report for the weekly option, then the Akixi Service will assume that Saturday and Sunday is not part of the working week. Therefore a weekly scheduled report run on a Saturday/Sunday will actually be run for the current week, but the same report scheduled for every Monday, Tuesday, Wednesday, Thursday and Friday will be run for the previous week
Call Control
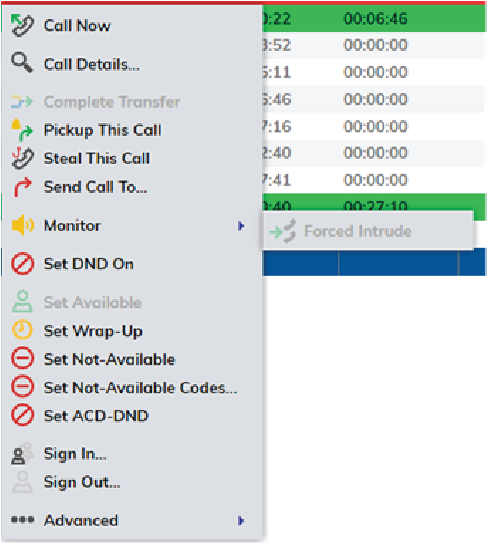
For certain real-time reports, call control is available when appropriately enabled by the Service Provider of the corresponding telephony platform. This can be achieved by left-clicking a row within the report. Please note that Akixi mirrors the functionality that the underlying platform provides.
Charting
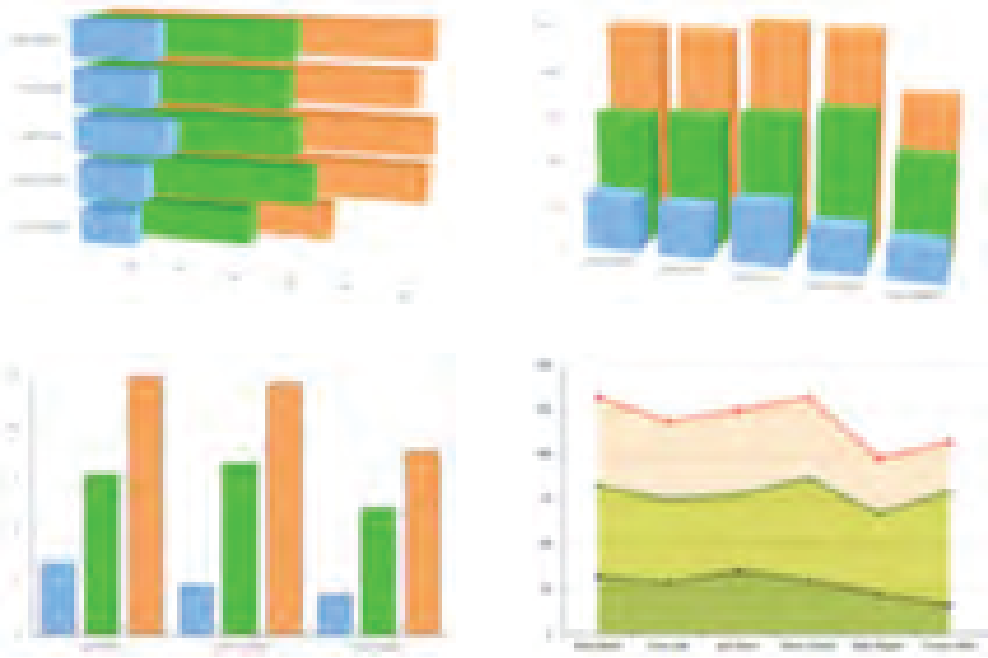
Most reports can be configured to be viewed as a chart, and the Akixi Service provides a very wide variety of chart types. To learn more about the charting feature, please refer to document “Akixi Introduction To Charting”.